From Whiteboards to Dashboards: Evolving Site Reporting
The transition from traditional whiteboards to digital dashboards represents a significant evolution in site reporting, particularly in industries such as construction, agriculture, and business management. This post explores this transformation, detailing key concepts, benefits, limitations, and how tools like Zepth can facilitate this change.
Traditional Whiteboards
Usage and Benefits
Whiteboards have long been essential tools for organizing and tracking important information on-site. In construction, they are commonly used for managing schedules, safety measures, and resource allocations. Additionally, in agricultural settings, such as sow farms, whiteboards facilitate oversight of daily responsibilities like feeding routines, medication protocols, and health checks. They provide a centralized location for team members to update and access information, ensuring everyone is aligned and informed.
Limitations of Whiteboards
Despite their utility, whiteboards come with significant limitations. They are fixed to a physical location, limiting access for remote teams or external consultants who may need to collaborate on project developments. Moreover, manual updates can lead to inaccuracies and inconsistencies, which complicates real-time decision-making. These drawbacks pose challenges, especially in industries like construction that rely heavily on accurate, timely data for effective management.
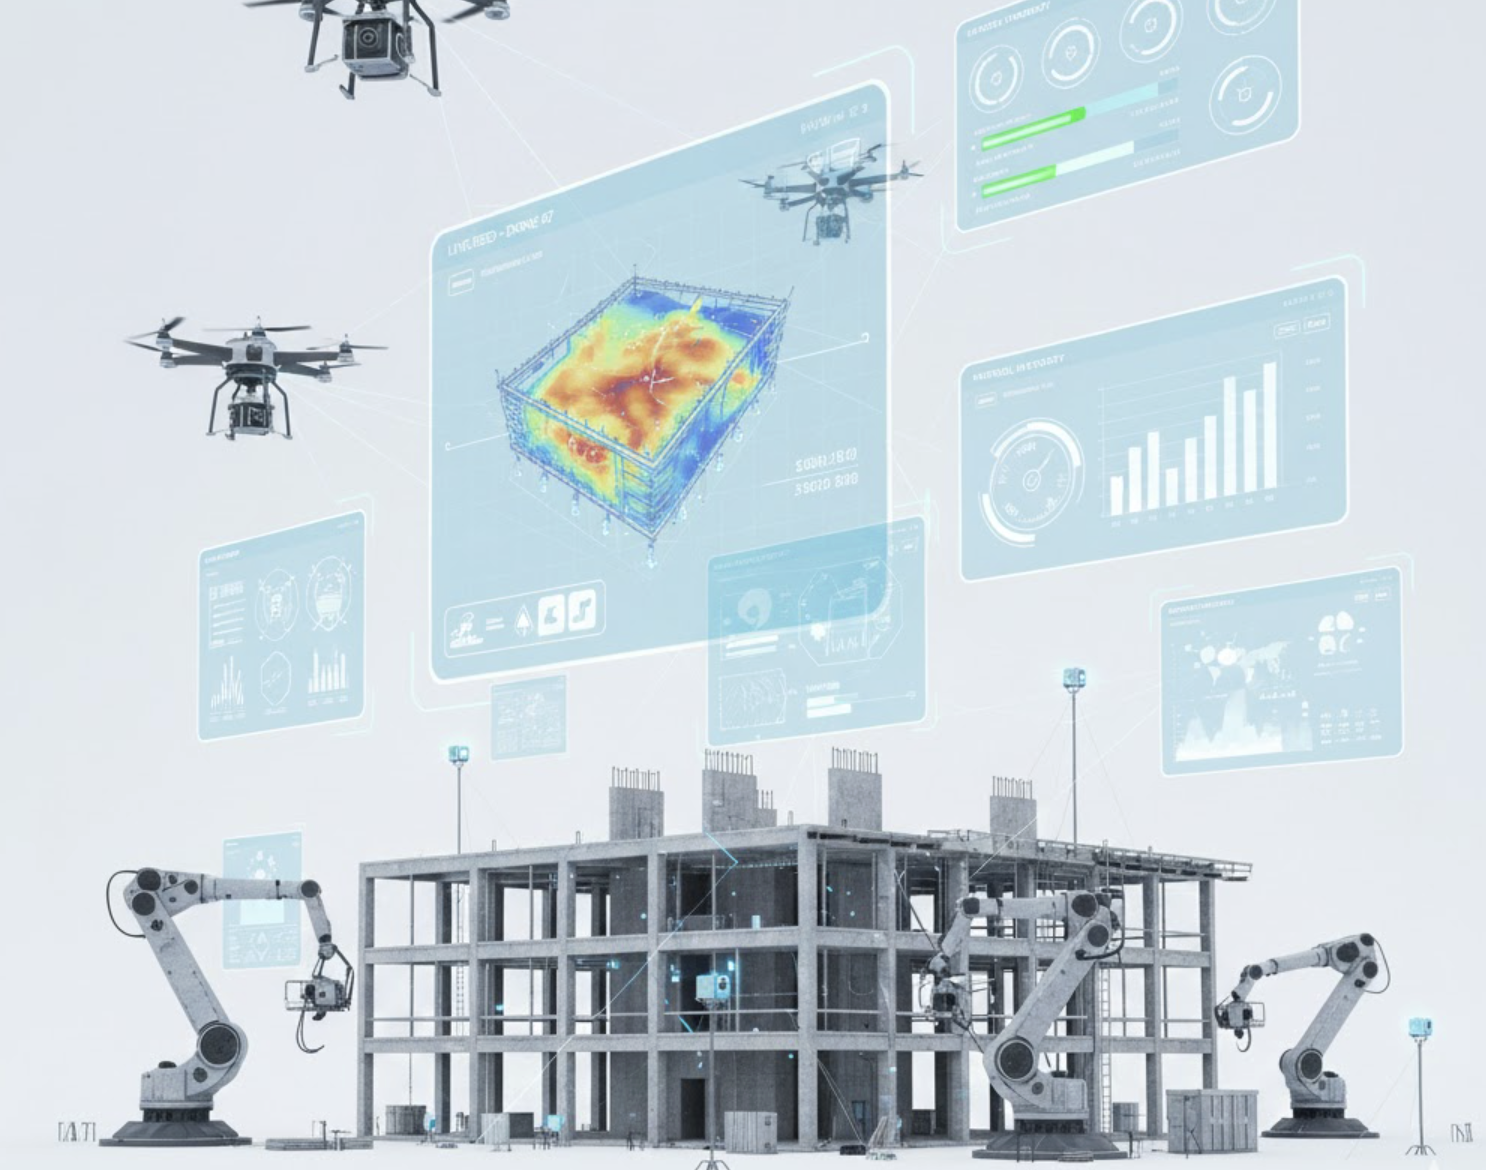
Digital Dashboards
Benefits and Advancements
Digital dashboards present numerous advantages over traditional whiteboards. They enhance accessibility, allowing remote teams and external consultants to access and update information in real-time. This immediacy significantly reduces risks of data inaccuracies by automating updates and delivering consistent, reliable data. Furthermore, dashboards can integrate various data sources, offering a comprehensive overview of site operations. This integration is vital for construction risk management and effective jobsite management.
Data Visualization and Interactivity
Unlike static reports, digital dashboards display data in interactive and visually appealing formats, such as charts, graphs, and spark lines. This interactivity not only captivates users but also enables them to analyze data at multiple granular levels, thereby facilitating well-informed decision-making. By leveraging construction analytics and insights, teams can respond promptly to emerging challenges and optimize project outcomes.
Best Practices for Implementing Digital Dashboards
Iterative Development
Implementing a digital dashboard should involve an iterative development approach. This ensures that the dashboard aligns with strategic goals effectively. By revisiting initial questions and collaborating with stakeholders, teams can define the purpose and operations of the dashboard clearly. Regular reviews and updates are crucial to ensure the dashboard remains relevant and effective over time.
Alignment with Strategic Goals
To maximize the effectiveness of a digital dashboard, it should track specific metrics that align with the organization’s strategic goals. In the construction sector, this might include monitoring project timelines, resource usage, and safety metrics. A targeted approach to data management ensures that teams focus on critical areas that contribute to successful project delivery.
User-Centric Design
When designing dashboards, it is essential to adopt a user-centric perspective. Dashboards should be intuitive and easy to navigate, catering to the end user’s needs and providing at-a-glance information relevant to their roles. This approach is vital for enhancing engagement and productivity among team members.
Use Cases
Construction Industry
In the construction industry, digital dashboards can significantly improve project management by allowing teams to manage schedules, allocate resources, and monitor safety measures in real-time. They can also facilitate construction risk management by providing early warnings for potential issues, enabling project teams to take proactive measures. Tools like Zepth’s Construction Progress Report can further enhance project tracking and reporting.
Agricultural Industry
In agricultural settings, digital dashboards oversee daily responsibilities such as feeding routines, medication protocols, and health checks. They also track crop yields, weather conditions, and other critical factors impacting agricultural operations, helping farmers make data-driven decisions and optimize production processes.
How Zepth Can Help
Construction Project Management Software
Zepth offers comprehensive construction project management software that can facilitate the transition from whiteboards to digital dashboards seamlessly. The platform provides real-time data management, automated updates, and interactive dashboards that enhance efficiency and accuracy in site reporting. By adopting a modern construction management approach, teams can effectively monitor progress and ensure transparency in every project phase.
Customizable Dashboards
Zepth enables users to create customizable dashboards tailored to their specific needs and strategic goals. The platform’s ability to integrate various data sources provides a holistic view of site operations, empowering users to make informed decisions promptly. Leveraging features like Zepth’s Document Register and Jobsite Management Tool enhances overall project management capabilities.
By leveraging digital dashboards and tools like Zepth, industries can significantly improve their site reporting practices. This advancement brings efficiency, accuracy, and enhanced accessibility to critical information, allowing teams to focus on what matters most – delivering successful projects. For more information on how Zepth can support your construction management needs, visit Zepth’s Why Zepth page.