Monthly board reporting in construction is overdue for a reset. A typical board pack demands days of manual work, yet still delivers lagging, inconsistent information. With the right hotel management software or construction platform and AI orchestration, that same monthly board pack can be 80% auto-assembled from live data, leaving leadership to focus on judgment, not spreadsheets.
Why Monthly Board Packs Must Evolve
A board pack in construction is a curated monthly snapshot of portfolio health. It blends time, cost, quality, safety, risk, and strategic KPIs across regions, projects, and joint ventures. For diversified owners and operators, especially in hospitality and mixed-use portfolios, that pack often also acts as a de facto hotel portfolio management system summary on which capital allocation and performance decisions rest.
Yet the preparation process remains largely manual. PMOs and project controls teams typically spend 5–10 days each month collating data from schedules, spreadsheets, site reports, and financial systems. Every extra copy–paste step raises the risk of error; PwC found that over half of organizations lack confidence in their project data because of fragmented, manual processes. By the time the board receives the document, a significant portion of the data is already two to four weeks old.
Leaders in both construction and hospitality now ask very practical questions: How do we cut the prep effort without losing detail? How can we trust the numbers more? How do we move beyond static PDFs to live, insight-rich views? The answer lies in connected data, automation, and targeted use of AI in hospitality and construction reporting.
Macro trends push hard in the same direction: larger and more complex portfolios, greater scrutiny of governance and ESG, rapid adoption of cloud-based platforms, and a maturing ecosystem of AI tools for hotels and asset-heavy businesses. With these capabilities, an 80% auto-assembled board pack is no longer aspirational; it is a practical target.
What “80% Auto-Assembled” Actually Means
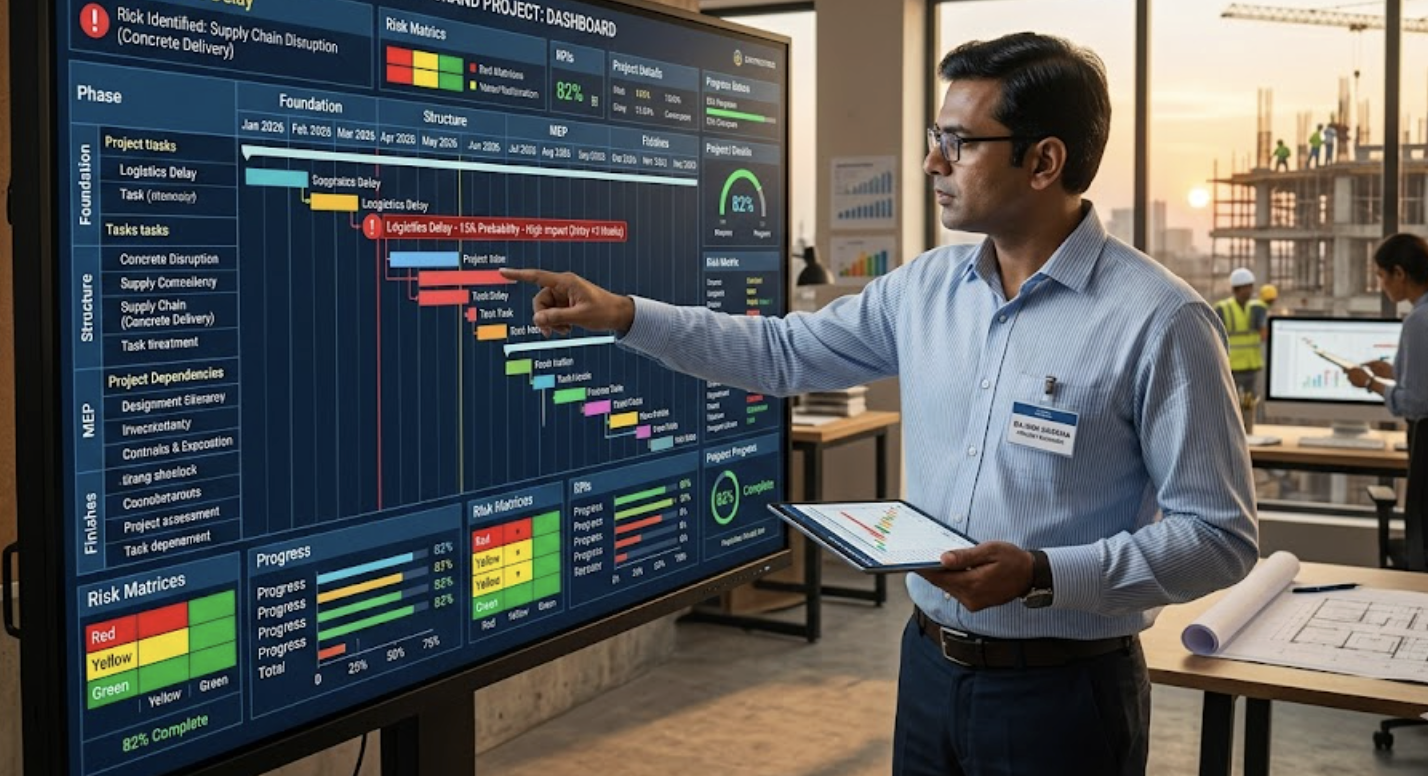
An 80% auto-assembled monthly board pack means that the bulk of the content—tables, charts, KPIs, and even first-draft commentary—flows directly from connected systems with minimal human intervention. Data moves from your project controls, site apps, and hotel financial management software into dashboards and narrative summaries without repeated manual handling.
In this model, automation manages data extraction, validation, and formatting. A single source of truth underpins the entire document, whether the subject is a tower under construction or an operational hotel that shares CAPEX, OPEX, and occupancy metrics. The remaining 20% is where leadership adds insight: context around market shifts, major risk events, and decisions that reshape the portfolio.
A common question here is simple and direct: Can monthly board reports be fully automated? The realistic answer is no—and that is a feature, not a flaw. Full automation would strip out judgment, negotiation, and institutional memory. The goal instead is to automate the repetitive, rules-based 80% and reserve human time for interpretation, trade-offs, and forward-looking guidance.
Well-designed automation has a few characteristic traits. It relies on a connected data environment rather than scattered files. It refreshes a consistent structure month after month, so the board can scan for change instead of relearning the document. It allows regeneration mid-cycle if the board asks for an updated view. And it maintains line-of-sight from every executive KPI back to underlying records, whether those are RFIs, safety observations, or line items in an AI asset management software ledger for a hotel property.
The Core Components of a Monthly Board Pack—and How Automation Helps
Across construction and hospitality portfolios, the same board pack anatomy appears again and again. Automation does not change this structure; it makes each section faster to assemble and more reliable.
Executive Summary and Portfolio Snapshot
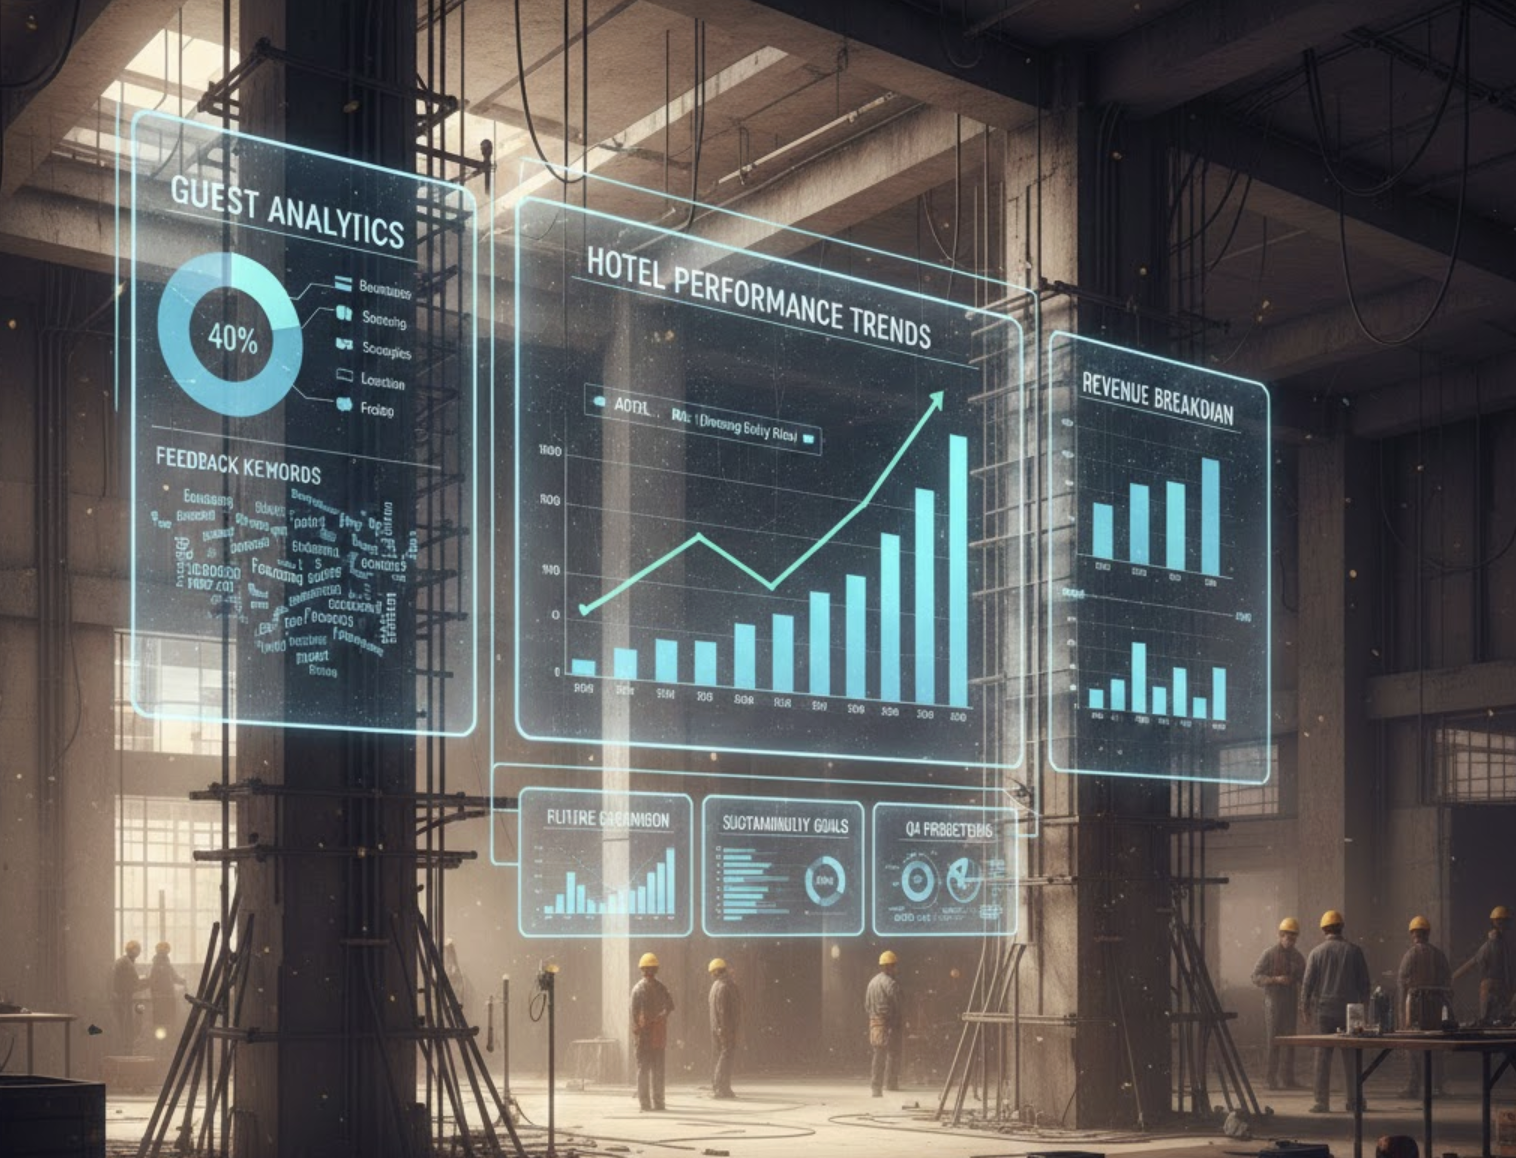
The executive summary provides a top-level read on portfolio health. It highlights the percentage of projects on time and on budget, calls out red-flag properties or contracts, and summarizes major movement in key metrics like cash flow, asset uptime, or occupancy. Within a hotel context, equivalent dashboards come from an intelligent hotel operations management platform that merges revenue, utilization, and service quality signals.
Automation can generate most of this summary from live data. Trend charts, heatmaps, and risk distributions draw directly from connected systems and AI-driven performance dashboards. An AI-powered hospitality management or construction analytics layer can even propose draft bullet points: biggest positive changes vs. last month, largest degradations, and hot spots by region or contractor. Leadership then refines this language and adds strategic commentary on regulation, financing, or market demand.
Time and Schedule Performance
Schedule reliability remains a central board concern. The board cares less about granular Gantt charts and more about whether milestones are slipping, which projects are driving delay risk, and how those delays affect revenue, openings, or guest capacity.
By integrating with scheduling tools, automation keeps schedule performance indicators current—Schedule Performance Index, milestone hit rates, and counts of milestones delayed beyond agreed thresholds. Variance charts and slippage flags update as planners revise dates. When a board member asks, “Which three projects now drive most of our delay exposure?” an automated, data-driven answer is immediately available.
Cost, OPEX, CAPEX, and Financial Performance
Financial sections anchor board-level oversight. In construction, this means budget vs. actuals vs. forecast at project, program, and portfolio level. For hospitality portfolios, that same view extends into recurring operating expenses and property-level P&Ls, all of which can be orchestrated by a robust hotel asset management platform or an intelligence edge such as Zepth Edge.
Connected hotel financial tracking software, ERP, and cost tools provide real-time feeds into dashboards that track variances, cost to complete, contingency drawdown, and cash flow. Hotel CAPEX control software and hotel OPEX management tools can sit on the same platform, so board-level packs show capital projects and operating budgets in the same frame. An AI financial reporting platform can then scan for anomalies: sudden spikes in maintenance, irregular vendor payments, or deviations from hotel budgeting and forecasting baselines.
At this point, many executives raise another question: What is the difference between CAPEX and OPEX in hotel operations, and why does it matter for the board pack? In practice, CAPEX covers long-term asset investments and major upgrades, while OPEX encompasses day-to-day operating costs like utilities, staff, and consumables. A board pack that separates and then reunites these views with clear hotel CAPEX optimization and OPEX trends gives directors sharper control over both short-term profitability and long-term asset health.
Risk, Issues, Quality, Safety, and ESG
Risk and ESG have moved from appendices to core board pack sections. Risk registers, issue logs, and compliance dashboards show where exposure accumulates; ESG metrics underscore how the portfolio performs against sustainability and social commitments. In hotel portfolios, this often ties directly into sustainable hotel management practices and long-term brand value.
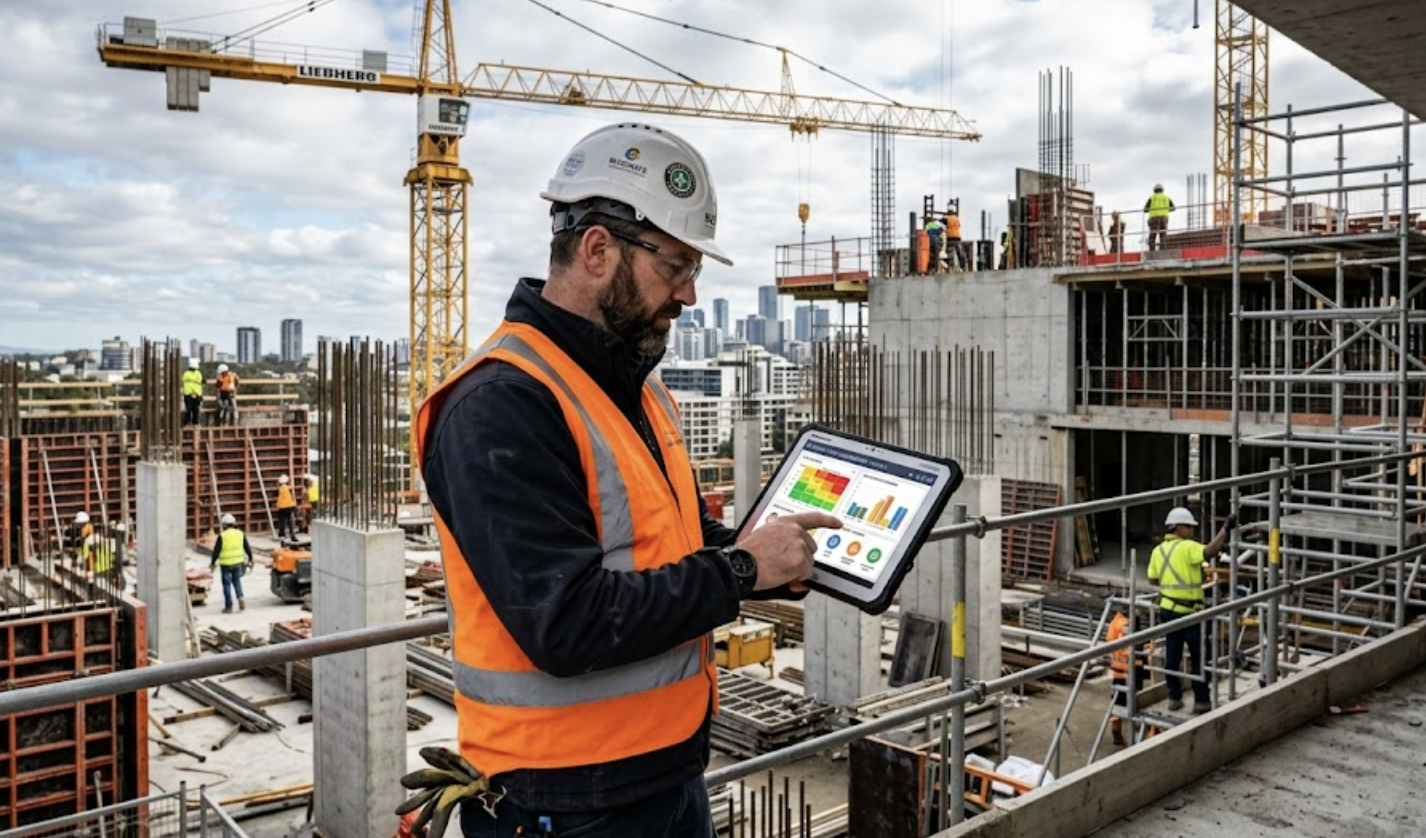
Automation aggregates risk data from each project into portfolio heatmaps, applying standard scoring models. It rolls up safety incident logs, quality defects, and ESG indicators into consistent metrics. Real-time ingestion from site apps and building systems allows the board to see not only lagging indicators—lost time incidents or carbon totals—but also leading indicators such as inspection completion rates or energy intensity per occupied room.
This is where IoT and AI in hotel operations and construction intersect. IoT sensors measure equipment performance, energy consumption, and environmental conditions. AI-led operational intelligence in hotels and on sites then converts those streams into alerts, forecasts, and benchmarks. In a monthly pack, the output looks like trend lines and league tables, but the board knows that behind every number sits a traceable data trail.
Procurement, Contracts, Change, and Governance
Boards also expect visibility on procurement status, contract health, and major changes. Central logs of tenders, awards, claims, and variations, linked into cost and schedule models, show where commercial pressure builds. In an operational hospitality context, these same capabilities support centralized procurement initiatives and vendor performance tracking via smart hotel management tools and procurement modules.
Automation compiles all change orders and claims, groups them by root cause, and shows their financial and schedule impact. Workflow data reveals how long approvals take and where bottlenecks lie. Governance dashboards report which mandatory reviews occurred, which decisions remain open, and how quickly actions from previous board meetings were closed.
- Executives see a single, coherent story from contract award to asset operation.
- Commercial teams gain portfolio-wide visibility on disputes and exposure.
- Boards track whether governance processes run as designed, not only as documented.
The same automation backbone that powers construction reporting can support a cloud-based, portfolio-wide hotel lifecycle optimization approach. Capital projects, refurbishments, maintenance cycles, and disposals all contribute data into a shared model of asset value over time.
How to Achieve an 80% Auto-Assembled Board Pack
Reaching 80% automation is primarily a data and process design challenge, supported by the right AI hotel automation platform or project ecosystem. The steps are clear: build foundations, standardize KPIs, layer automation and AI, then keep humans firmly in the loop.
Data Foundations and a Single Source of Truth
First, data must live in a connected environment rather than in disconnected spreadsheets and emails. A common data platform gathers documents, RFIs, cost events, safety observations, and asset details in one place. For hospitality, that same backbone also acts as a cloud-based hospitality management system and cloud-based property management integration hub, unifying PMS, POS, finance, and maintenance feeds.
APIs and structured integrations matter more than ad-hoc exports. Once schedule, ERP, procurement, building management, and site tools all publish into a single repository, automated extraction and transformation flows can keep metrics current with minimal manual work. Reliability of the board pack then rises, because every data point follows a repeatable, visible path from source system to executive slide.
Standardized Metrics, Templates, and Thresholds
Second, KPIs and layouts must be standardized. A board-level KPI catalogue defines which indicators matter most: schedule indices, cost variances, asset uptime, hotel revenue management analytics, guest satisfaction scores, carbon intensity, and so on. Clear formulas and thresholds produce consistent traffic lights across projects and properties.
Templates then map each KPI to a position in the board pack. Every month, automation refreshes the content within that structure rather than rebuilding it from scratch. Over time, the board learns where to look and how to compare performance across JVs, brands, or regions. This is the essence of smart portfolio performance management: standard inputs feeding standard views, without sacrificing the ability to drill down when nuance matters.
Automation, AI, and Human-in-the-Loop Review
Third, an automation and AI layer carries data from source to insight. ETL pipelines run on schedule, updating both operational dashboards and the board pack snapshot. Report templates draw on live data to assemble charts and tables. An analytics layer provides early-warning signals: rising risk scores, deteriorating energy intensity, or maintenance backlogs that threaten guest experience.
AI then assists with narrative: summarizing month-on-month changes, highlighting anomalies, and proposing key talking points. Governance workflows ensure that project managers, cost leads, and asset managers review and sign off their portions before anything reaches the board. This combination mirrors the best practices of data-driven hospitality management and advanced project controls: automation for scale, human oversight for quality.
A recurring question at this stage is practical: How long does it take to transition from manual to automated board packs? The answer depends on data maturity, but many organizations find that a focused pilot on a subset of projects or properties can show results within a few reporting cycles. Once KPIs, data contracts, and templates stabilize, scaling to the full portfolio becomes far easier.
Benefits of an 80% Auto-Assembled Board Pack
The benefits of an automated board pack go beyond time savings. They touch the speed and quality of decisions, regulatory confidence, and the culture of the organization.
On the time side, PMO and finance teams often see preparation effort fall from seven to ten days per month to one or two. Manual spreadsheet consolidation shrinks dramatically, error rates drop, and rework loops shorten. Freed from repetitive collation, teams can invest more time in analysis, scenario modelling, and actionable recommendations—precisely the areas where human expertise creates value.
Decision quality also improves. Board members view near-real-time indicators instead of month-old snapshots. Trend lines and predictive models support questions like: If this flagship hotel’s renovation slips by three months, what happens to cash flow, debt covenants, and brand health? If we defer this capital project, how does that affect long-term asset lifecycle management for hotels and guest experience? Integrated hospitality forecasting tools and construction analytics can now answer such questions faster and more credibly.
Governance and transparency gain as well. Every figure in the board pack links back to underlying records and workflows. Audit trails, approval histories, and standardized definitions simplify internal and external reviews. In sectors under growing ESG scrutiny, automated data collection and roll-up also strengthen hotel compliance and audit software capabilities and reduce the risk of inconsistent disclosures.
Finally, culture shifts. When leaders trust their hospitality analytics and insights or construction dashboards, they use them more often. Decisions move away from anecdote and toward measurable impact. Report preparation becomes a byproduct of running the business in a digital, standardized way, rather than a monthly ordeal.
How Zepth Edge and the Zepth Ecosystem Enable 80% Auto-Assembly
The Zepth ecosystem is designed to deliver this level of automation in complex, asset-heavy environments. While Zepth Core orchestrates construction delivery and Zepth Flow manages procurement, Zepth Edge focuses specifically on financial, CAPEX, and asset intelligence for portfolios such as hotels, resorts, and mixed-use developments.
Zepth Edge acts as an AI-driven hotel management and performance command center. It unifies MIS, CAPEX, OPEX, and asset data into one connected platform, giving owners and operators a real-time view across every property. In practical terms, it functions as a cloud-native hotel asset management platform and hotel portfolio management system that feeds directly into the monthly board pack.
Key Zepth Edge modules align naturally with the sections of an 80% auto-assembled report:
Financial Overview: This module centralizes portfolio-wide profit, revenue, and expense metrics. It sits at the intersection of hotel financial management software and AI analytics, producing live dashboards and board-ready summaries of P&L performance, cash flow, and budget adherence.
Occupancy & Utilization: Here Zepth Edge tracks occupancy rates, utilization patterns, and revenue-per-asset. These metrics underpin hotel revenue management analytics and reveal underperforming rooms, spaces, or properties. Board packs can show which assets contribute most to portfolio returns, and where pricing or mix optimization is needed.
Guest and Customer Segmentation: This module analyzes guest demographics, preferences, and behavior. It provides a data-rich lens on market positioning and targeted offerings. For the board, it delivers concise, auto-generated views of segment profitability and strategic focus areas, leveraging AI in hotel budget planning and marketing spend.
Service Quality: Zepth Edge collates operational efficiency, response times, and guest satisfaction metrics. Leaders see the relationship between service scores and revenue, and how operational initiatives affect outcomes. This aligns with emerging expectations for next-generation hospitality platforms that unify experience and financial metrics in one view.
Budget Management and CAPEX Management: These modules digitize both OPEX and CAPEX planning and control. Structured, traceable approvals and workflows support tight hotel OPEX control software and CAPEX tracking in hospitality. For the board, Zepth Edge auto-assembles CAPEX pipeline views, budget utilization, and forecast updates, helping to deliver up to 30% CAPEX efficiency gains and sharper capital deployment.
Asset Register and Asset Disposal: Zepth Edge maintains a single source of truth for asset location, condition, and lifecycle. It tracks acquisitions, maintenance, upgrades, and disposals with full financial transparency. These modules are fundamental to hotel lifecycle optimization and sustainable investment decisions; automated roll-ups show where aging assets risk downtime or guest dissatisfaction.
MIS Reporting and Operations & Service: Integrated MIS brings together financial, operational, and asset data into one reporting layer. The Operations & Service module manages service requests, case volumes, and property-level performance. For the board pack, these modules combine to offer concise yet deep real-time hospitality data analytics drawn from everyday operations.
Beyond Zepth Edge, other parts of the Zepth ecosystem contribute to the 80% automation goal. Zepth Core offers project controls, quality, safety, and risk management—ideal for capital projects and new builds. Zepth Flow embeds procurement oversight, while Zepth Anly, the AI orchestration platform, powers cross-ecosystem AI-powered hospitality management and predictive analytics. Zepth Bldz extends digital control to SMB projects, feeding data into the same intelligence layer when required.
Together, these platforms create a unified, cloud-native environment—a cloud-based hospitality management system for operations plus a construction and CAPEX control backbone. From this environment, monthly board packs emerge largely pre-assembled, leaving leadership to add the final 20% of insight, direction, and accountability.
As digital transformation in hospitality and construction accelerates, organizations that embrace this model gain an enduring edge. They decide faster, with better information. They align CAPEX and OPEX to strategy more tightly. And they treat reporting not as a burden, but as a continuous, intelligent dialogue between data and decision-makers.