In today’s high-stakes construction environment, every executive wants actionable financial insights at a glance, yet many project cost dashboards fail to deliver what truly matters. Construction project management software platforms promise clarity and visibility, but without careful planning, your dashboard can drown in data. Using AI-driven construction management and smart design, it’s possible to build a project cost dashboard that actually earns executive focus, drives faster decisions, and makes a clear impact on the bottom line.
Why Most Project Cost Dashboards Fall Short
Executives crave real-time answers to fundamental questions: Are we on budget? What’s at risk? Where should we act? Unfortunately, many traditional dashboards serve up a sea of raw numbers, incomplete charts, and outdated figures. Often, dashboards lack the contextual clarity, predictive analytics, or visual simplicity needed for C-level decision-making.
Modern construction financial management tools and AI construction automation provide the foundation to change this picture entirely. But remarkable dashboards don’t happen by accident. Blending ease of use, accessibility, powerful analytics, and integration with your cloud-based construction management platform is essential if you want results that leadership genuinely values.
What Should Your Executive-Facing Cost Dashboard Show?
The essence of a great cost dashboard is clarity. At its core, it should answer, simply and quickly:
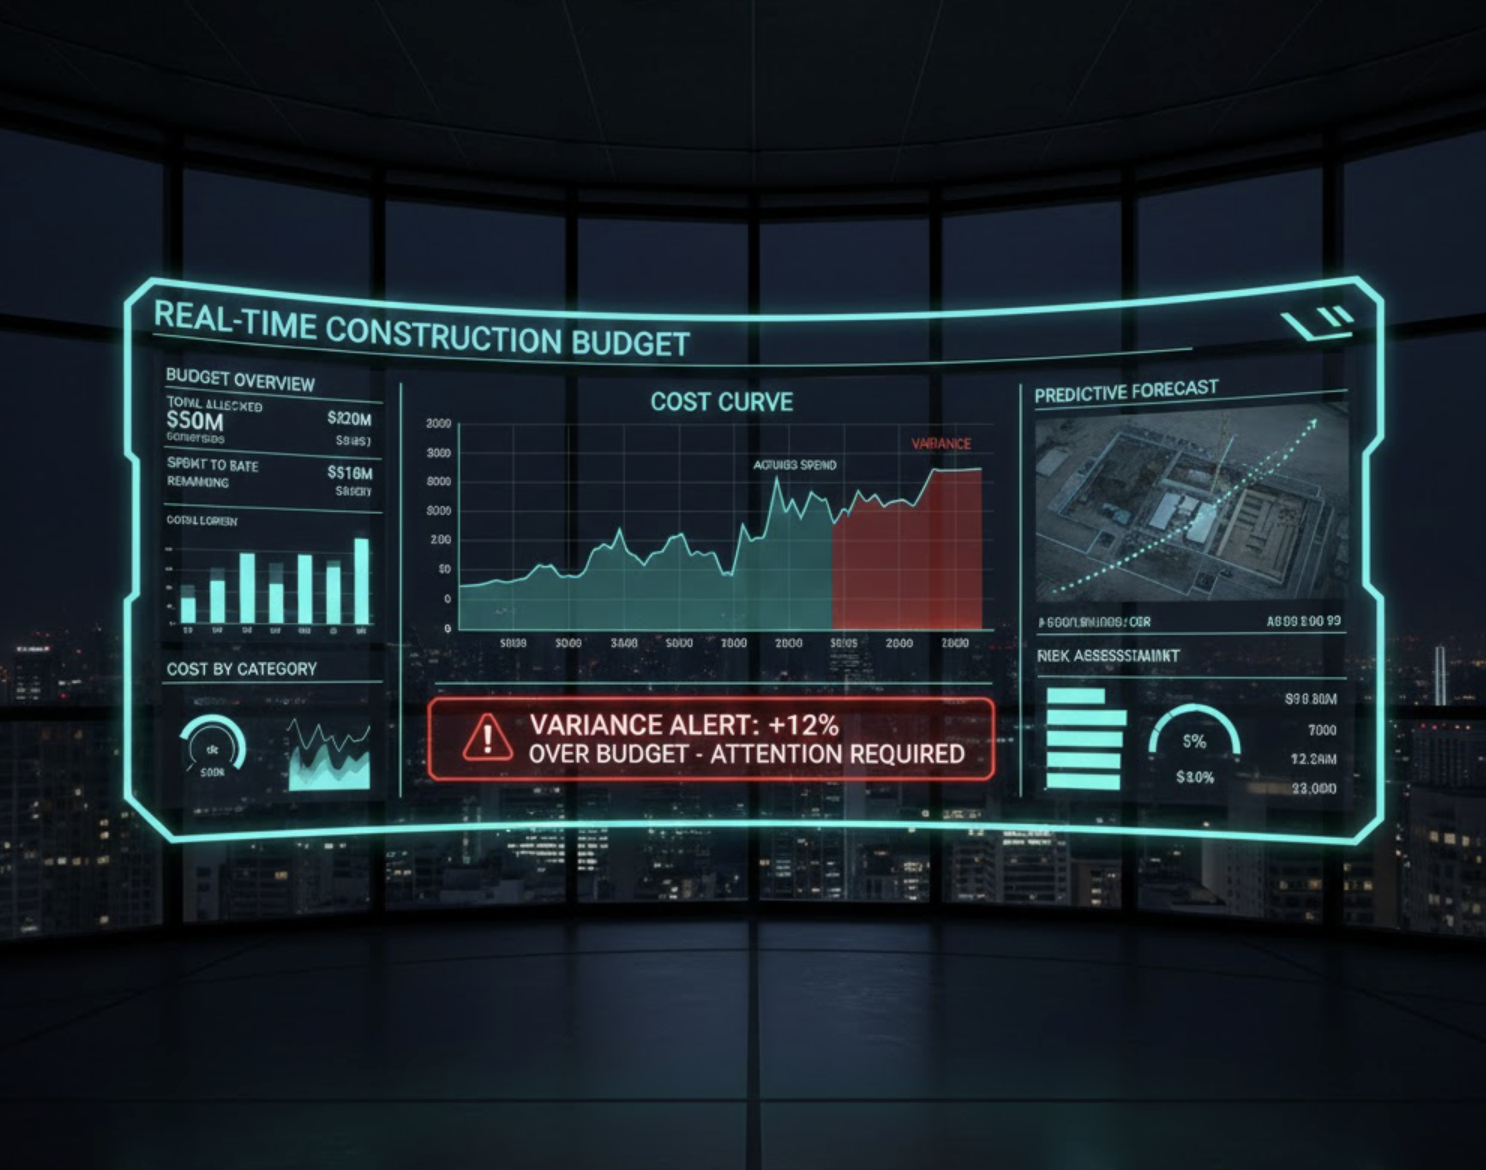
- Current project budget vs. actuals: Are we trending on or off plan?
- Forecasted costs and cash flow curves: What are we projecting for completion?
- Breakdown by trade, phase, or package: Where are variances emerging?
- Major cost risks and contingencies: What risks may impact the financial trajectory?
- Contract, change order, and claim summaries: Which items are causing swings to the budget?
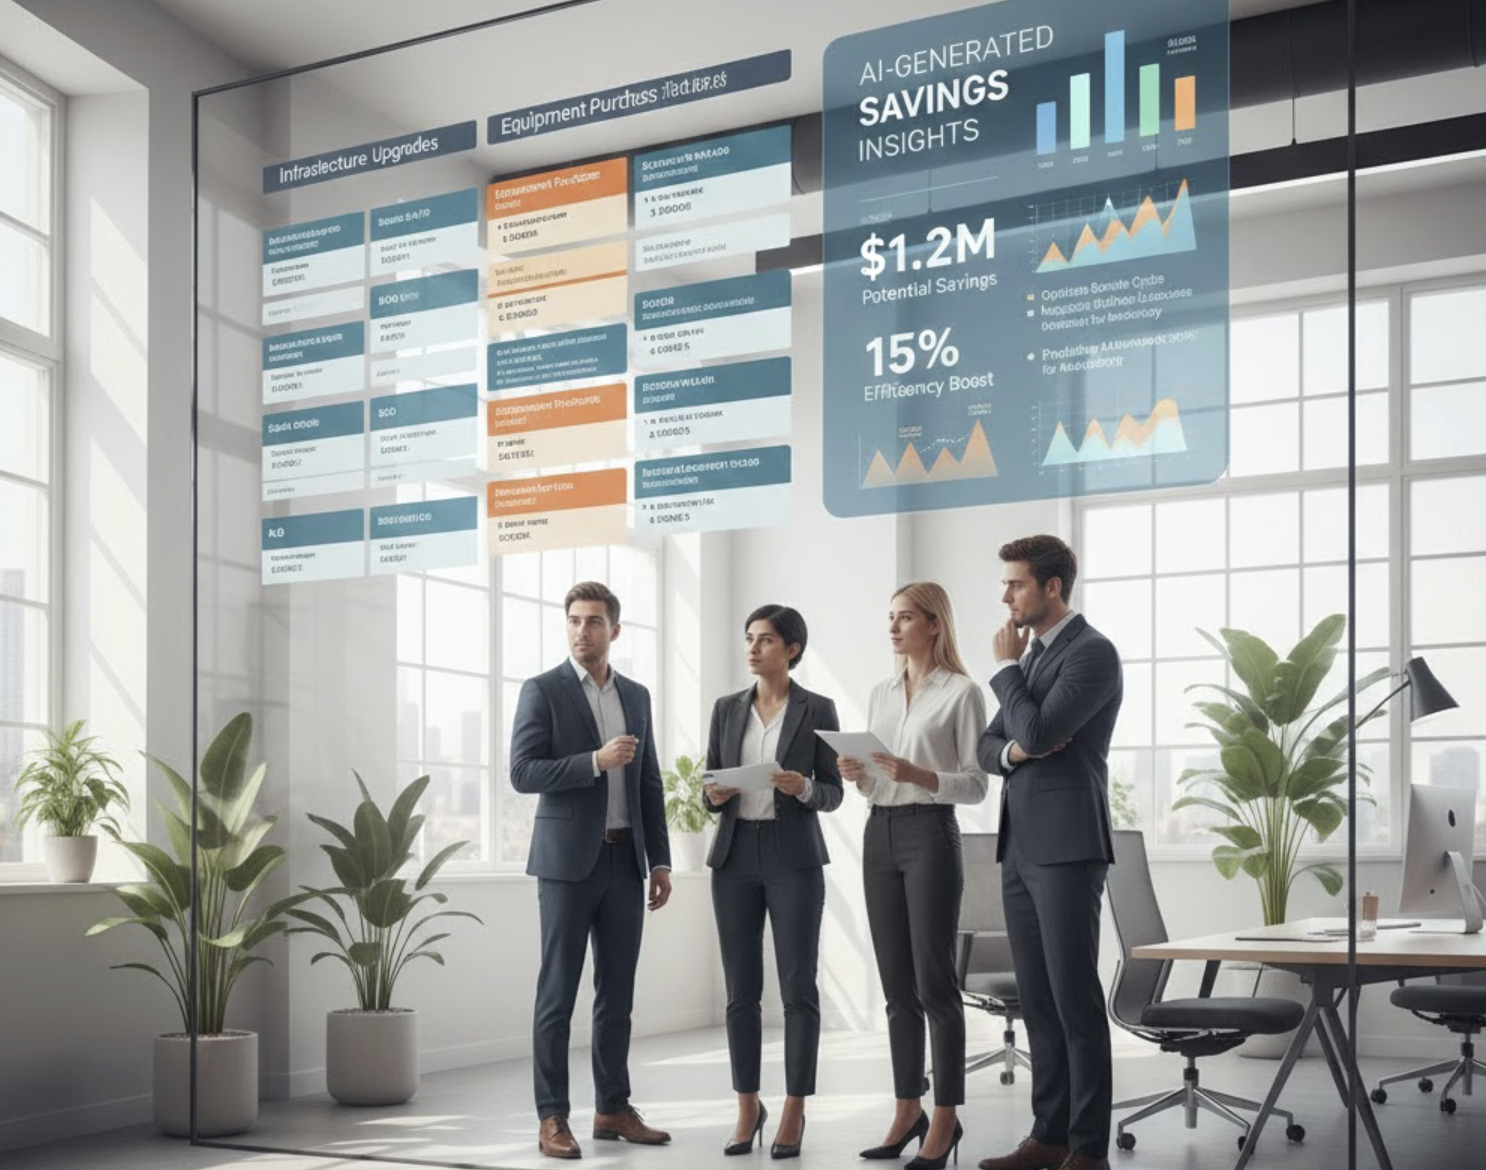
When you assemble cost data using a unified platform like Zepth Core, it’s possible to create these visualizations seamlessly. Zepth’s project cost control and insights & analytics modules enable you to surface current progress, committed costs, exposures, and forecasted overruns as intuitive visuals. Executives benefit from instant clarity, with drill-down flexibility when needed.
Key Features of Smart Cost Dashboards in Construction Tech
To create executive dashboards that stand out, you need more than just static charts. Today’s AI-powered project management platforms—particularly those designed for the construction industry—offer several advanced features:
Zepth Core, for example, empowers users with:
- Automated, real-time financial tracking: Seamlessly import invoices, outlays, and allowances as they happen, eliminating data latency.
- AI-powered forecasting: Predict future cost overruns or savings using trend analysis, reducing the guesswork common in project budgeting tools for construction.
- Interactive data visualizations: Personalized dashboards with filter, drill-down, and trend-spotting tools to help executives “see the story” behind the numbers.
- Embedded risk analytics: Instantly see not just where costs stand, but also which risks may shift the forecast and why—supported by construction risk management and detailed risk registers.
- Mobile accessibility: With Zepth’s cloud-first approach, access actionable financial metrics from office or field, enabling on-the-go executive oversight.
Frequently, users wonder: “How do you ensure project dashboards stay accurate and current?” Choose software that integrates tightly with jobsite management tools and document flows, so data streams automatically from daily field reports, RFIs, progress updates, and contract changes. Zepth’s common data environment for construction architecture ensures a single source of truth for every stakeholder.
Design Principles: Making Data Readable and Actionable
Presenting financial data for executive consumption demands more than cramming graphs on a screen. Executives have minimal time—data must cut through the noise. Here are core guidelines for effective construction project dashboards:
- Start with high-impact KPIs: Surface only those metrics that directly affect business outcomes. Think margin, cost-to-complete, and risk-adjusted forecasts.
- Layer the details: Enable drill-downs for deeper context, but keep the top dashboard uncluttered. Busy executives can find detail without distraction.
- Use visuals that guide focus: Heatmaps, trend arrows, and variance color-coding tell a quick, actionable story.
- Contextualize with benchmarks: Show actuals, planned, and variance in one view; offer industry or phase comparisons where possible.
- Flag exceptions automatically: Let AI-driven construction management flag potential overruns, compliance risks, or delayed claims automatically via alerts.
Zepth’s financial dashboards employ these principles, combining graphical highlights with deep drill-downs—always with real-time data. For example, the cost dashboard’s interface is tightly woven with the risk mitigation in construction module, giving an instant look at which factors most imperil your cost baseline and what proactive mitigation plans are underway.
Bringing AI, Analytics, and Automation Together
The leap forward in construction analytics and insights now comes from AI technology. With modules like Zepth Anly, the analytics suite leverages predictive models and learning algorithms to forecast budget variances, flag anomalous trends, and optimize spending proactively.
A commonly asked question is, “How can AI help optimize construction cost control?” AI construction automation can learn from your past projects, current spend patterns, and risk profiles to recommend optimized procurement timings, identify supply chain inefficiencies, and even suggest corrective actions before issues escalate. Through connected insights across jobsite management, document management, and project financials, you get a comprehensive cost control system.
Transparency and clarity matter beyond finance, too. For example, with Zepth’s integration of BIM (Building Information Modeling) and digital twins, you link cost entries to specific models and field progress, offering a visual, contextualized window into spending versus outcomes. Smart construction management tools mean executives can ask why costs exceed plan, view the site virtually, and connect cause and effect—all from the same dashboard environment.
Best Practices for Implementing Your Executive Dashboard
To make your dashboard a must-have tool for decision-makers, follow a set of proven steps:
- Engage C-suite stakeholders in the design phase: Have them specify which data types and visualizations actually influence their actions. The dashboard should answer their top questions by default.
- Integrate with your core systems: Your platform, like Zepth Core, should ensure all jobsite information, cost controls, and risk logs feed directly into the dashboard, preserving data accuracy through a construction lifecycle management software approach.
- Leverage role-based views: Present granular detail to project controllers and a synthesized, strategic snapshot to the executive team.
- Test and refine: Pilot with real projects, gather feedback, and iterate until usage, not just access, becomes routine at every executive meeting.
Users often ask: “What are the most important KPIs to track for construction project cost control?” Essential KPIs include budget variances, committed vs. actual cost, contingency status, return on investment, spend by trade, cash flow forecasts, change order impacts, and flagged high-risk exposures. Zepth’s insights and analytics module centralizes all these for instant executive oversight.
Cloud-based construction management guarantees your dashboards are available anywhere, anytime—meeting the needs of today’s hybrid, fast-moving teams. Zepth Bldz extends these financial metrics even to mobile, field-based leadership, so everyone can act—no matter where they work.
Conclusion: Making Project Cost Dashboards That Drive Executive Action
Executives don’t want just another report—they need instant situational awareness, sharper foresight, and effortless clarity. By employing AI tools for construction and leveraging digital transformation in the industry, your organization can deliver cost dashboards that are not just read, but relied upon.
With platforms like Zepth Core, which synchronize financial tracking, risk management, document flow, and analytics in a unified AI construction platform, your cost dashboard becomes the tool leadership trusts for every major decision. The result: greater cost discipline, reduced surprise overruns, proactive responses to risk, and full transparency from ground break to completion.
For forward-looking leaders, a project cost dashboard powered by smart construction management tools isn’t just nice to have—it’s the engine of real-time control and long-term project success.